Goaltide Daily News 2020
Nov 20, 2020
News 1:
India’s mask of economic liberalism is off: The Hindu
Syllabus Reference: GS-III
Effects of liberalization on the economy
Article throws light on the debate-Is Indian economy a liberal one in real sense? There are very good arguments presented. The article also tries to explain liberalisation in detail and the way forward.
News 2:
How tech can play a role in combating antimicrobial resistance: The Hindu
Syllabus Reference:
GS-II
Issues relating to development and management of Social Sector/Services relating to Health, Education, Human Resources.
GS-III
Science and Technology- developments and their applications and effects in everyday life.
We already know that Anti-microbial resistance is a cause of concern in front of us. Article reiterates this fact by explaining how India is one of the largest consumer of human antibiotics as well as animals’. It then explains how technology can aid in tackling the issue.
News 3:
Public debt in India: Business Standard
Syllabus Reference: GS-III
Government Budgeting.
For those who don’t have access to the newspaper, we are providing the article below. Carefully observe the images and the trends.
Globally, fiscal financing is a ubiquitous issue and in that India is no exception. Whether it is tax revenue sharing between Centre and States, recovering from a financial crisis, or a raging pandemic, all of these have a bearing on a nation’s public debt. While India’s public debt-GDP numbers are not as sordid as in some parts of the world, it is important to understand the factors that have helped shape its public debt dynamics. It is also important to understand the role played by important macro-economic reforms in shaping India’s debt trajectory.
How has public debt evolved in India historically?
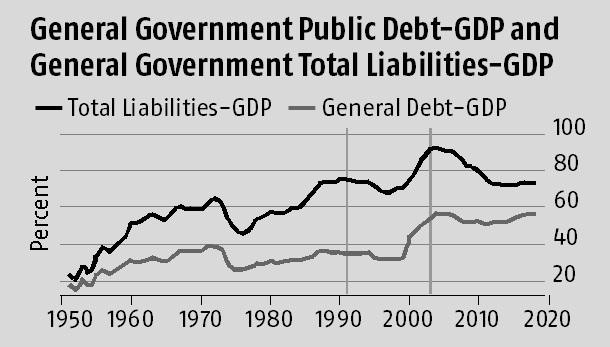
In 1951, Indian general (Centre plus State) public debt was approximately 18.5 per cent of GDP, rose steadily to about 39 per cent till 1972, and then fell sharply to 26 per cent in 1975. It plateaued till the mid–1990s, averaging 32 per cent between 1975–1996. After 1996, general debt-GDP ratio shot up to 57 per cent in 2005, (a rise of about 26 per cent points in nine years), falling to about 50 per cent in 2011 and then rising back to 57 per cent in 2018.
How has public debt evolved in India in the post-liberalisation period?
In the decade following the 1991 liberalisation, general debt-GDP ratio stayed constant till 2000 averaging 34 per cent close to the average (30 per cent) between 1950–1990. Post-2003, due to the Fiscal Responsibility Budgetary Management (FRBM) Act of 2003 and
the high growth years (2003–2009), the debt-GDP ratio declined marginally to 52 per cent in 2009. While the share of the general debt-GDP from 2004–2018 has been relatively constant and has averaged 54 per cent, there has been a larger decline in the total liabilities owing to a decline in the proportion of liabilities in the public account. Since the Great Financial Crisis (GFC), between 2009–2018, the general debt-GDP ratio has averaged 53 per cent.
In recent research (see https://www.isid.ac.in/Rs cghate/DG_WP_2020.pdf), we assemble a novel dataset with consistently defined aggregate annual components of Indian public debt from 1951 to 2018. We also assemble granular Centre-State security level data from 2000 to 2018. (The results from the security level will be discussed in Part 2 of this article). We use a Hall-Sargent debt decomposition framework to quantify the extent to which inflation, real GDP growth, nominal interest rates and the primary deficit/surplus explain the historical evolution of Indian public debt-dynamics. While inflation, the growth rate and the primary surplus help reduce the debt-GDP ratio, the nominal interest rate and primary deficit add to it. The decomposition allows us to understand which of these factors drove the evolution of public debt historically and in the post-liberalisation era.
As summarised in the table, since 1963, the largest increase in public debt happened during 1999–2008, when public debt exploded from 33 per cent to 52 per cent. This surge was primarily due to the 1995 5th Pay Commission awards, which were later implemented by the States. We also find that inflation’s largest impact on eroding public debt (41.8 per cent) happened in the 2008–2018 period because of the high inflation rates during 2009–2014 (averaging about 10 per cent). In the 1990-1999 sub-period, when debt-GDP declined by 2.5 per cent points, inflation’s impact on this change was also fairly large (30.5 per cent), with growth and inflation cumulatively decreasing debt-GDP by close to 45 per cent (30.5 per cent + 14.5 per cent). Somewhat worryingly though, over the sixty-year period that our sample covers, inflation’s contribution to lowering public debt has successively become larger across time periods suggesting that debt liquidation by inflation has been a dominant force historically. GDP growth exerts a strong downward influence on public debt in both the 1999-2008 (pre-GFC period) as well as the 2008-2018 (post-GFC period). The primary deficit’s largest impact on the debt-GDP ratio happens in the eighties, 1981-1990. This was because fiscal policy was loose throughout much of the eighties.

How did macroeconomic reforms affect the debt-GDP ratio?
We consider three reforms: The dismantling of administered interest rates (a process that culminated in 1997), the FRBM Act of 2003, and the adoption of (de-facto) inflation targeting from 2014. The dismantling of administered interest rates should have contributed to instilling a lower interest rate regime in the economy. This is, however, not borne out in the analysis. The contribution of nominal interest rates to the change in the debt-GDP ratio rises to 32.3 per cent between 1997-2018 compared to 25.3 per cent in 1959-1997.
Around the implementation of the FRBM, we find that the primary deficit’s contribution to the change in the debt-GDP between 1991-2003 was 20.9 per cent compared to 10.8 per cent in the period after the implementation of the Act (2003-2018). Decomposing this period annually, we find, however, that while the contribution of the primary deficit to the change in the debt-GDP ratio fell till about 2008, it began to rise between 2008-2018. This suggests a mixed record of the FRBM in curbing India’s debt-GDP ratio in the post-liberalisation period.
Finally, while India adopted Flexible Inflation Targeting (FIT) in 2016, several elements of this landmark reform were put into place in 2014 (implementation of a bi-monthly policy review cycle, bi-annual publication of Monetary Policy Reports, announcement of a glide path for headline inflation, and making CPI-headline inflation the nominal anchor, amongst others). We, therefore, consider 2014 to correspond to the de-facto adoption of FIT in India. Our results show that while inflation’s contribution to reducing public debt has become larger over time, it has begun to diminish after the adoption of de-facto FIT in 2014. Somewhat encouragingly, when we compare 2009-2014 with 2014-2018, we find that the contribution of inflation to the change in the debt-GDP ratio falls from 26.9 per cent to 10.6 per cent, respectively. Interestingly, the nominal interest rate contribution to debt-GDP in the same period also fell from 6.5 per cent in 2009-2014 to 4 per cent.
Our results show that while the adoption of inflation targeting has diminished the role of inflation in debt-liquidation (and, therefore, weakened the forces of fiscal dominance), the large contribution of nominal interest continues to pose a challenge to debt management in India.
<< Previous Next >>